Event Display Window 
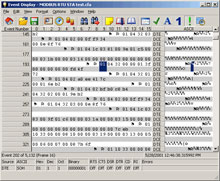
Event Display Window - The captured data includes data bytes, time stamp, control signal states, and line errors. Byte value can be displayed in hex, decimal, octal, binary, and either ASCII, EBCDIC, or Baudot. The software calculates the time difference (Delta time) between selected bytes or events. Users can open multiple Event Display windows to view different segments of the captured data and quickly find byte-oriented errors and timing issues. The Event, Frame and Statistics Displays are all synchronized.
Find Function - Users can search data as it is being captured or after it has been saved. The find function allows users to quickly pinpoint problem areas. Users can find a specific event in the data stream by searching for time (absolute or relative), errors, and signal changes or data patterns. Find Function
Breakout Box Window Breakout Box Window - The software provides a graphical view and real time status of the major RS-232 control signals: DTR, RTS, CTS, DSR, CD, and RI. The software counts and displays the number of control signal state changes.
Signal Display Window - The software provides a graphical view of live control signal transitions and even after they have been saved. The Zoom function allows users to view the state of control signals for a range of events, or changes over a capture session. The "Snap To" feature simplifies problem isolation by causing the cursor to snap to the nearest signal change. Signal Display Window
Event Export Event Export - Users can export Event level information in to text, Excel, HTML, or binary format. The output is human readable and suitable for importing into a spreadsheet or database, or usable by other programs. Users can select the range of events to export.