NetDecoder can be used effectively to detect communication problems at an
early stage. This reduces network downtime and saves network operators a lot
of money. In order to detect communication problems easily, NetDecoder's
analyzers include the Dashboard feature. This dashboard shows the live
status of the network in an easy-to-comprehend graphical display. The
dashboard highlights the key aspects of the network that contribute to the
overall system health. The dashboard is customizable and also includes
alarming capabilities. The dashboard is available for Ethernet and
DH+
networks.
Ethernet Dashboard Display
NetDecoder's Ethernet analyzer includes the Ethernet
Dashboard Display
 This display can be used to analyze industrial control networks such as
Ethernet/IP, ModBus/TCP, PROFINET, DNP3 over
Ethernet, CSP and PCCC over Ethernet. The display can also be used for
all general Ethernet communications traffic. The Ethernet Dashboard View
provides a graphical insight into the dynamics of the Ethernet network.
NetDecoder is a passive network monitor and does not contribute to network
loading.
This display can be used to analyze industrial control networks such as
Ethernet/IP, ModBus/TCP, PROFINET, DNP3 over
Ethernet, CSP and PCCC over Ethernet. The display can also be used for
all general Ethernet communications traffic. The Ethernet Dashboard View
provides a graphical insight into the dynamics of the Ethernet network.
NetDecoder is a passive network monitor and does not contribute to network
loading.
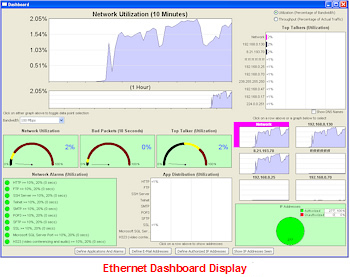
Key Features of the Ethernet Dashboard Display
- Network Utilization Meter with Background Color Alert.
- 10 Minute Histogram of Network Utilization.
- Graphic Specific Activity can be Tied Back to Packet Decode Details.
- Network Meter for Bad Packets with Background Color Alert.
- Top Talker Meter with Background Color Alert.
- Top Ten IP/MAC Addresses Contributing to Network Traffic.
- 10 Minute Histogram of Top Ten IP/MAC Address Activity.
- Distribution of TCP/or UDP Application Related Communications
Protocols.
- Network Alarms for Unauthorized IP Addresses.
- Network Alarms for User Define Protocol Alarm Levels.
- Email Notification Option for Alarms.
- Display Options for 10MB, 100MB and 1GB Network Speed.
To learn more about troubleshooting Ethernet networks, download a NetDecoder
demo. You can also order your
copy of NetDecoder online.
Data Highway Plus (DH+) Dashboard Display
NetDecoder's DH+ analyzer includes the DH+
Dashboard Display
.
This display enables you to see the health and dynamics of what is occurring
on your Data Highway Plus network. Periodically monitor your DH+ network
with NetDecoder to stay on top of developing situations that could cause
performance or network problems. NetDecoder is a passive monitor and does
not contribute to network loading.
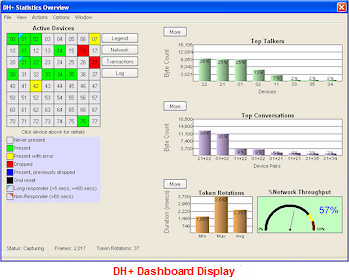
Key Features of the DH+ Dashboard Display
- Active Devices and Status Chart
- Identifies Active Devices on the bus.
- Identifies if a Device has Dropped Off the Bus.
- Identifies if a Device had Previously Momentarily Dropped Off
the Bus.
- Identifies Long Responders - Device which took from 5 to 60
Seconds to Respond.
- Identifies Non-Responders - Device did not Response in 60
Seconds.
- Top Talker Chart with Top Eight Devices Identified and Conversation
Levels Specified.
- Top Conversations Chart with Top Eight Conversation and Activity
Levels Displayed.
- Token Rotation Summary - Min/Max/Avg.
- Network Throughput Meter with Background Color Alert.
- Works with Data Highway Plus Bus Speeds of 57.6Kbps, 115.2Kbps and
230.4Kbps.
To learn more about troubleshooting DH+ networks order your
copy of NetDecoder online.