|
Frame Analysis
View data at varying levels of granularity, from
frame/message
level to bit/byte level, on the
Frame Display Window .
And, decode your hex/oct/dec/ASCII data from the
Event Display Window
into easy to understand English on the Frame Display Window's
Decode Pane .
Frames containing errors are highlighted in red in the Frame Summary
pane, indicating the availability of detailed error analysis information
in the Frame Decode pane. The level of drill-down analysis detail and
the size of each drill-down pane are completely user controlled.
Multiple Frame Display Windows can be opened simultaneously to allow
users to view different sections of the captured data. Since all windows
are synchronized, a range of events selected in the Frame Display Window
will also be selected in all other windows and panes. This can be a big
time saver when looking for timing problems with the
Event Display Window .
|
Frame Summary
View a one line high-level overview of each data frame/message using the
Summary Pane .
Select a protocol layer and the most significant fields are displayed in
a concise form. Selecting a frame causes a detailed view to appear in
the Frame Decode pane. In order to facilitate troubleshooting, all panes
are adjustable in size and are synchronized - selecting a frame in the
Summary pane automatically updates the other panes, and selecting an
item in the Decode pane highlights the corresponding bits or bytes in
the other panes. Frames that contain protocol errors are highlighted in
red. The new Summary Layer quick-filter creates a separate display that
only includes frames/messages that contain the protocol layer you have
selected, making it easy to zoom in on your messaging/protocol problems.
Frame Summary information can be exported into CSV format and loaded
into a spreadsheet or other program to do intricate statistical analysis
of protocol and network information. |
|
|
Frame Decode
View a comprehensive layered decode of each frame/packet through the
Decode Pane .
Each field of a data frame is decoded layer-by-layer using a tree
structure, with clear, concise descriptions. Selecting a field will
automatically highlight the associated bytes in binary, hex, and ASCII.
Selecting an item in the Decode pane will also highlight corresponding
bits/bytes in other panes. Use the Summary pane to identify protocol or
messaging problems and then drill-down using the Decode pane to solve
the problem. Use the
Decode Pane
synchronized with the
Event Display Window
to decode your hex/oct/dec/ASCII data into easy to understand English. |
|
Frame Level Search
Examine and search data as it is being captured (or after it has been saved), through use
of the
Find Function .
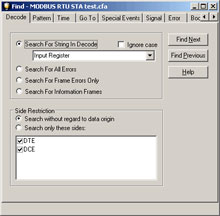
Use the Find Function to quickly pinpoint problem
areas in the captured data or to move to a specific frame. The frame level Find Function
can 1) search the text of the decode for a specified string, 2) search for errors, and 3)
limit the search to DTE or DCE. Data searches can also be performed at the byte level. |
Tab Filters
Tab filters within the Frame Display window allow you to filter out all
messages/frames that do not contain the specified protocol. This feature
simplifies the process of drilling down into your messages/frames. |
|
|
Quick Filters
Quick filters within the Frame Display window add powerful, yet easy to
use filtering to include or exclude/hide messages/frames that contain a
specific protocol, and it also allows you to filter on specific
messages. |
To learn more about troubleshooting Serial communications,
download a Serialtest demo.
You can also order your copy of
Serialtest online.