|
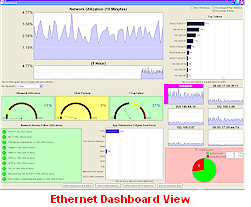
This is the Ethernet Dashboard
Display Window
 for
TCP, Ethernet, UDP, IPv4, IPv6, ARP, DNS, DHCP/BOOTP, HTTP, ICMP,
IGMP, LLC 802.2, LLDP, IBM NetBIOS, NBDS, NBNS, NBSS, NCP, RARP, SMB,
SMTP, Novell Netware (IPX, SPX, IPX NetBIOS, NPX ROP, IPX SAP, NCP), and
ISO CLNP. The Ethernet
Dashboard includes: Top Talkers, 10 minute Histogram for Network
Utilization, Histogram on Top Talkers, Alarms and protocol activities
and more.
for
TCP, Ethernet, UDP, IPv4, IPv6, ARP, DNS, DHCP/BOOTP, HTTP, ICMP,
IGMP, LLC 802.2, LLDP, IBM NetBIOS, NBDS, NBNS, NBSS, NCP, RARP, SMB,
SMTP, Novell Netware (IPX, SPX, IPX NetBIOS, NPX ROP, IPX SAP, NCP), and
ISO CLNP. The Ethernet
Dashboard includes: Top Talkers, 10 minute Histogram for Network
Utilization, Histogram on Top Talkers, Alarms and protocol activities
and more. |
Ethertest's new Dashboard View enables you to see the dynamics
of what is occurring on your Ethernet communications network. See an
overview of the top talkers, protocol statistics, network utilization along
with network alarms for the section of the network you are monitoring.
Ethertest is a passive monitor and does not contribute to network loading.
Dashboard Activity View
- Network Utilization Meter with Background Color Alert.
- 10 Minute Histogram of Network Utilization.
- Graphic Specific Activity can be Tied Back to Packet Decode Details.
- Network Meter for Bad Packets with Background Color Alert.
- Top Talker Meter with Background Color Alert.
- Top Ten IP/MAC Addresses Contributing to Network Traffic.
- 10 Minute Histogram of Top Ten IP/MAC Address Activity.
- Distribution of TCP/or UDP Application Related Communications
Protocols.
- Network Alarms for Unauthorized IP Addresses.
- Network Alarms for User Define Protocol Alarm Levels.
- Email Notification Option for Alarms.
- Display Options for 10MB, 100MB and 1GB Network Speed.